Cost Analysis Dashboard
Understanding the Metrics
Common Table Columns
Before diving into specific views, these columns appear across multiple tables:
| Column | Description |
|---|---|
| Total Cost | The total spend for the selected time period |
| Value Change | Difference in cost compared to the previous period of equal length |
| % Change | Percentage change from previous period |
| Annualized Amount | Projected annual cost based on current usage |
| % of Total | Percentage this item represents of the total cost |
- Service Costs
- Warehouse Costs
- User Costs
Service Cost Distribution
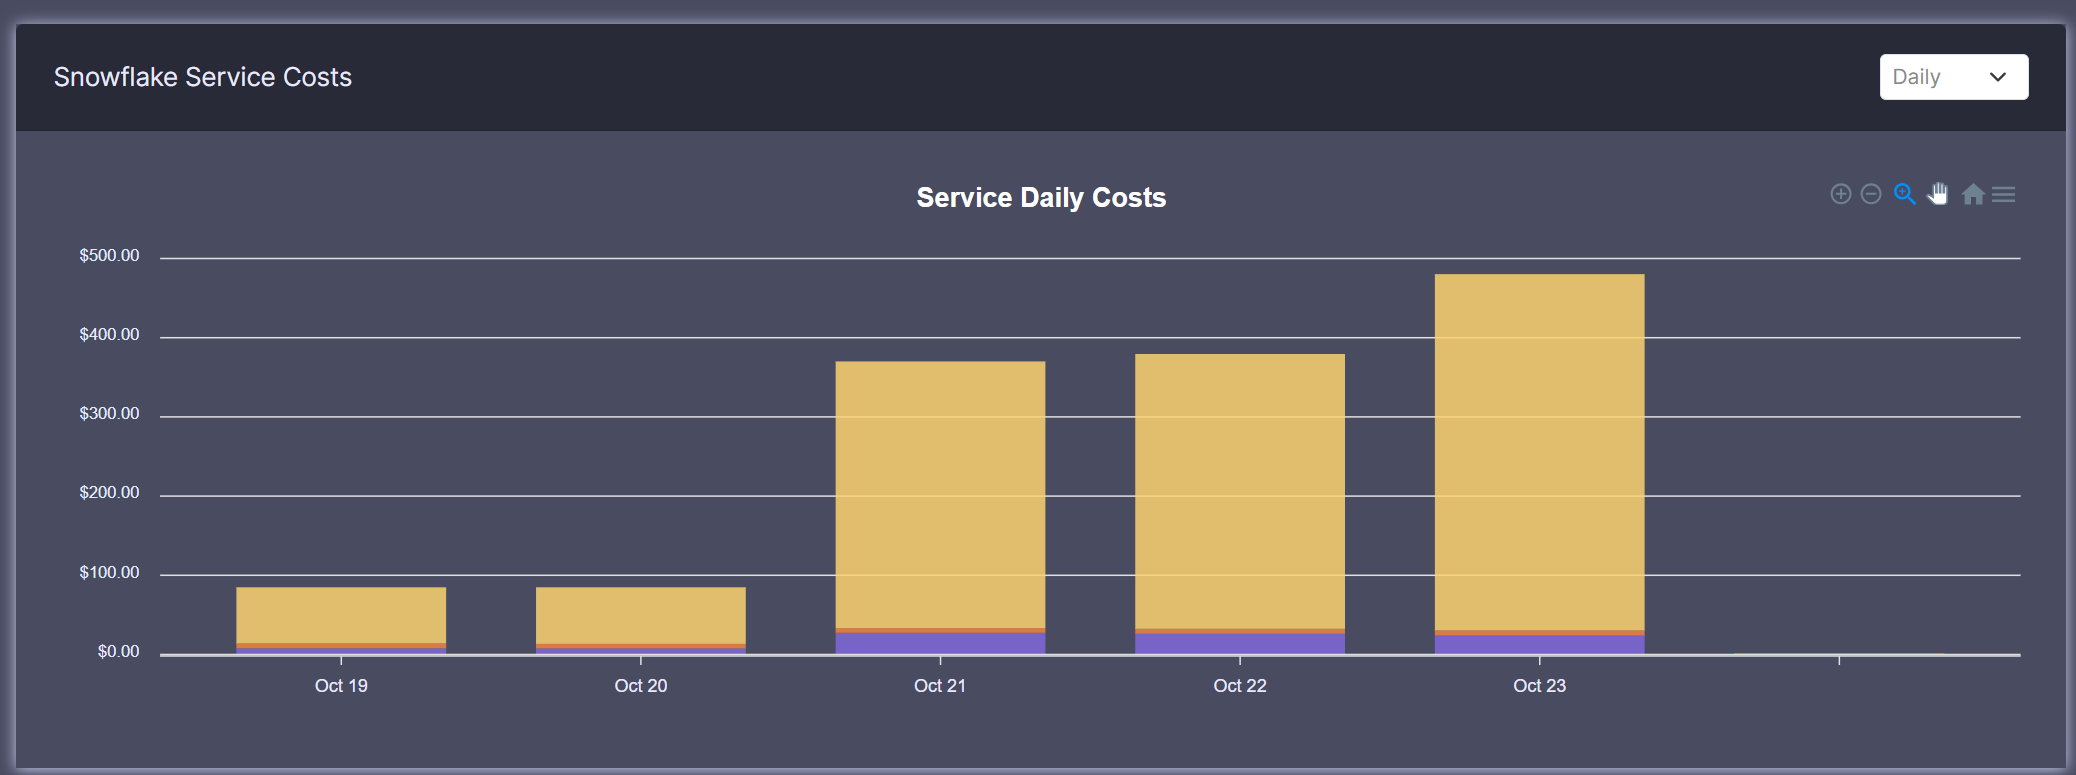
Understanding Service Costs Table
This table breaks down costs by Snowflake service type:
- Compute: Costs from warehouse usage
- Storage: Data storage costs
- Cloud Services: Background operation costs
Example Analysis
// How annualized amount is calculated
const annualizedAmount = (currentSpend / selectedDays) * 365;
Reading This Table
- High compute costs might indicate optimization opportunities
- Storage costs growing rapidly? Consider data lifecycle management
- Monitor cloud services for unexpected spikes
Warehouse Cost Distribution
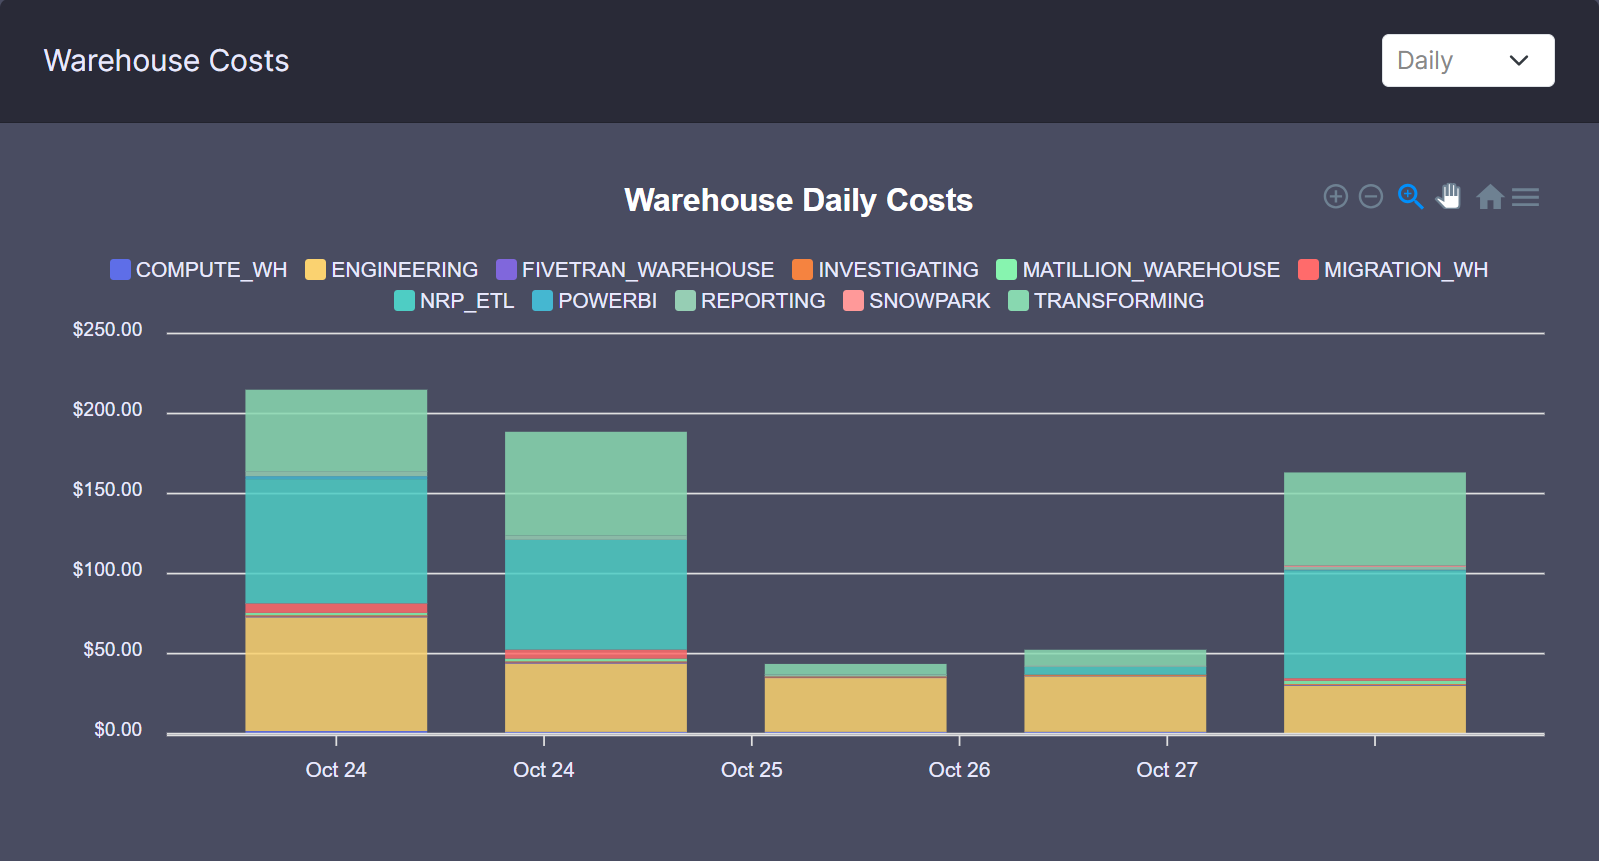
Understanding Warehouse Metrics
The warehouse table includes unique columns:
| Column | Description |
|---|---|
| Compute Credits | Total credits consumed by this warehouse |
| Utilization | Percentage of active time vs. available time |
Utilization Calculation
const utilization = (queryRuntime / warehouseUptime) * 100;
Low Utilization?
A utilization under 50% might indicate opportunities to:
- Adjust auto-suspend settings
- Resize warehouse
- Review scheduling patterns
User Cost Distribution
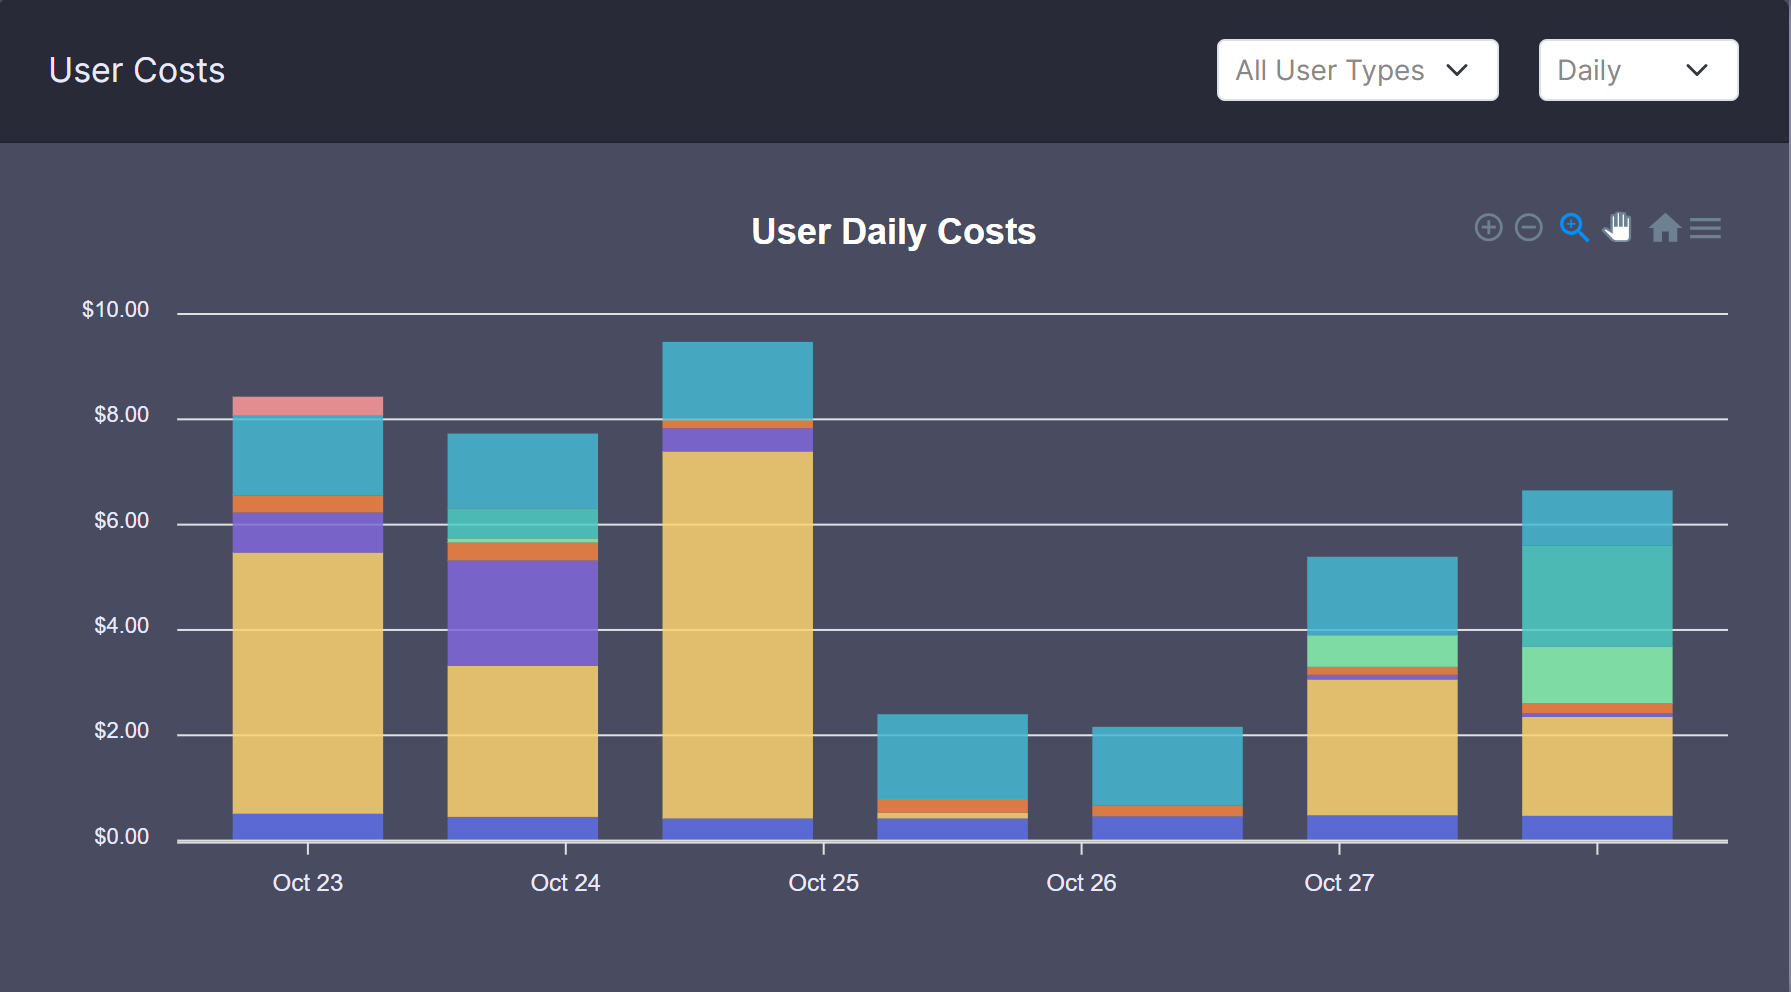
Understanding User Metrics
The user table shows:
| Column | Description |
|---|---|
| Type | User Account or Service Account |
| Annualized Credits | Projected annual credit usage |
User Types
- User Account: Individual human users
- Service Account: Automated processes/integrations
Interpreting User Costs
- High individual costs might indicate training needs
- Service account costs help track automation expenses
- Compare users within same departments for benchmarking
Using This Dashboard
Common Use Cases
-
Budget Tracking
- Monitor costs across services
- Track user spending
- Forecast annual expenses
-
Optimization Opportunities
- Identify expensive warehouses
- Find underutilized resources
- Spot costly user patterns
Best Practices
- Review costs regularly (weekly/monthly)
- Compare similar time periods
- Investigate significant changes (>20%)
- Use filters to focus on specific areas
Data Refresh
Tables update daily. Last refresh date is shown in the dashboard header.